We are building an open public map of Wales with all the names in Welsh. Because of recent work, the map will load much faster for you now.
Here’s what we did to improve the map loading speed.
When you load the map, what you’re seeing is a grid of tiles. Each is a square image file, like this:

A JavaScript library called Leaflet manages your navigation around the map (panning and zooming). The main point is, it’s ultimately made up of images.
These tile images are rendered from the underlying map data in OpenStreetMap, which is stored as points, ways, and relations. As well as the data, the OpenStreetMap software stack developed by the project is also freely licensed.
The most time consuming part of showing an up-to-date map to a user is converting the data into images. This tends to be done when the user loads the map: the images are generated and served, and also stored in a cache on the server.
If the map were completely finished and final then that would help. We could make sure the server has the tile images all rendered and stored, and serve them every time. But that’s not an option for the whole map for a couple of reasons.
At the moment the Mapio Cymru map is updated automatically once every night when most people in Wales are asleep, and server capacity tends to be higher. These updates are necessary because geographical map features and names change often, whenever somebody makes an edit to OpenStreetMap. This is often an improvement to the map, e.g. somebody adding a name to a feature. The open data elements are constantly being revised, making it a bit like a Wikipedia of maps. The edit can also be a response to something changing in the physical world, e.g. a café changing its name or perhaps a lovely new railway station.
Therefore we can’t preserve the map in aspic, it’s changing all the time.
It turns out there’s another snag to the idea of pre-rendering and storing the whole map to speed up loading. There is a different set of image tiles at each zoom level. For the furthest zoom levels it is possible to store all the tile images. But for closer zoom levels, the total number of tiles grows exponentially. Pretty soon we need a vast amount of time and storage space, much more than we have.
For example all of Wales at zoom level 17 took a little over seven hours to render overnight. That’s too much.
Can we pre-render and store some selected tiles, and then render any others on demand? It turns out that we can. The challenge is to figure out what to pre-render for maximum speed advantage, given the constraints of time and storage.
What are the map areas of ‘interest’ or ‘relevance’, and how do we codify this more precisely?
Initially we had a hypothesis that for the map sparsely populated areas would be less frequently visited than densely populated areas. One method would be to pre-render areas above a certain population density threshold.
I then realised that there was another solution much more ready to go, and even better. We could refer to aggregated browser requests for tiles to see which parts of our map were visited most. This allows us to look at the historical popularity of areas right down to individual tile level. This was data we already had, lying in the server logs.
Here’s a heat map produced by Ben Proctor.
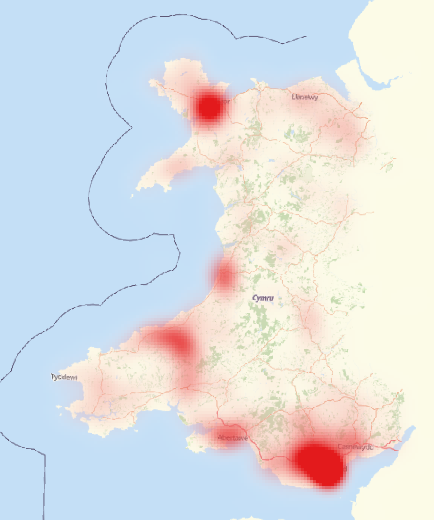
The popular areas do seem to correspond to population density. There may also be a relationship with the number and/or percentage of Welsh speakers in different areas, which is available from Census data.
I’ve instructed the server to pre-render these tiles and store them. We have chosen these areas:
Zoom levels 3 to 16 are now entirely pre-rendered.
Zoom levels 17 and 18 are now partially pre-rendered.
Now the server automatically pre-renders these areas every night, immediately after importing the up-to-date data.
The difference was very noticeable when I loaded the site before and after the change. Beforehand I’d been a bit embarrassed about the huge blank areas and the apparent freeze-ups of the map, while the server wheezed along. I am not experiencing that anymore – at least for now!
On average, tiles are loading in 40% of the time when pre-rendered. That’s a dramatic improvement, although the degree of speed-up is highly dependent on how many users are accessing the server at once.
Even tiles that are not pre-rendered are loading faster because there is usually more capacity on the server.
Incidentally the smooth running of the server also depends on choosing the right settings and configuration. (We briefly considered nginx as an alternative to Apache but it appears not to have an equivalent of the mod_tile module.)
As we gain more interest and users for the map I expect to have to visit this again. Your contributions to project costs are always useful.
2 replies on “Mapio Cymru now loads faster. Here’s what we did to speed up the server”
Dw i newydd dod yn aelod 🙂 Diolch am y map!
Roeddwn i’n wneud yr un map gyda Google Maps rhyw deng mlynedd yn ôl, a mae eich map chi yn LLAWER well!
Rhaglennwr ydw i, felly, os eisiau cymorth, croeso!
Gyda llaw, oes modd dangos gororau ar y map? Siroedd, hen siroedd, cantrefi, plwyfau?
Helo Dmitri, diolch yn fawr am y sylw a’r cynnig o help.
Pa fath o bethau wyt ti wedi mwynhau gwneud ar fapiau a data yn y gorffennol?
Fe wnawn ni ystyried gororau yn sicr!